
Before delving into the core problem of the Affordable Care Act (ACA), let me first start by unequivocally stating that in the United States far too many people lack access to affordable health care and a solution to this problem is desperately needed. Let me also be equally clear in stating that if a conscious effort had been made to devise the worst possible solution to this problem, such a plan could not be any worse than the currently implemented ACA.
The core problem with the ACA is that it provides an extremely strong financial disincentive for people to earn more money. When people realize this, the cost to the government, both due to subsidies and lost tax revenue, will quickly become untenable. The remainder of this document provides concrete evidence for the above claims.
To understand the matter at hand, it is important to understand how ACA subsidies work. There are two key elements involved in calculating subsidies: household income and the price of the benchmark health plan.
- The contribution to the cost of health insurance is capped for those whose adjusted gross income (AGI) (IRS Form 1040, line 37) up to 400% of the federal poverty level (FPL). In 2014, for a household of two, 400% of the FPL is $62,040. Those making this amount are expected to contribute 9.5% of their AGI towards health insurance.
- The benchmark plan is defined to be the second lowest cost silver-tiered plan available to a household.
The subsidy is calculated as the difference between the cost of the benchmark plan and the household contribution. In this article, the benchmark plan is used as the plan of choice for the two hypothetical households discussed. Thus, for a household earning just less than 400% of FPL, their contribution is exactly 9.5% of AGI.
To perform the following analyses, it is necessary to assume the future value of a number of key parameters. Each of those assumptions are listed at the end of the article, along with the method used for estimating the parameters value.
For the purpose of this study, we will examine the difference in household wealth for two, two-member households. Both members of both households are 50 years old in 2014 and none have preexisting conditions or smoke. For the first case to be examined, in 2014, Household 1 has an AGI of $62,040 and Household 2 has an AGI of $62,041. This trivial difference in AGI greatly impacts the households ‘net’ income, wherein for this article, ‘net’ income is defined as AGI minus federal taxes minus health insurance premiums. (For the purpose of calculating taxes, both households are assumed to take the standard deduction.)
The following plot shows the net income for both households for ten years, starting in 2014
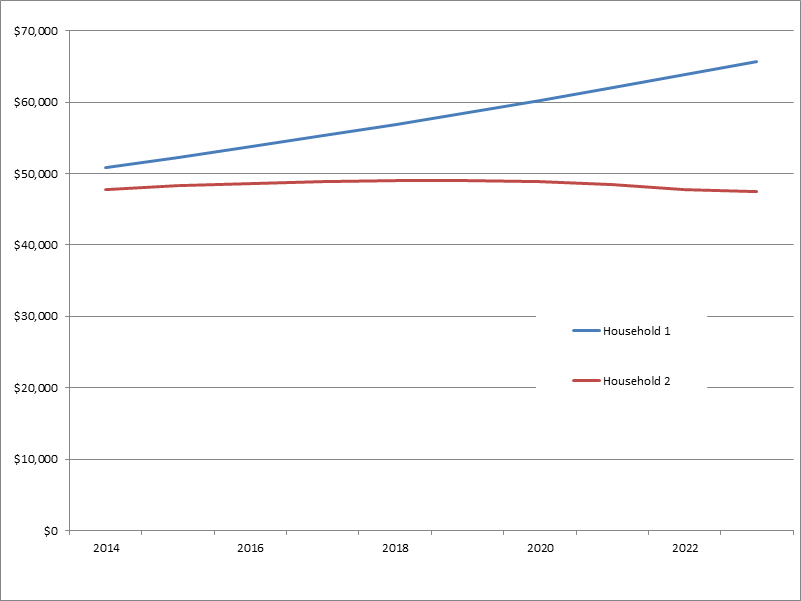
Due to the $1 difference in AGI, Household 2 is not eligible for subsidies. Since the cost of insurance increases faster than household incomes increase (which is further exacerbated by increasing costs due to increasing age of the household), Household 2 perennially has less net income than Household 1, despite having an AGI that is $1 greater each year. (In fact, Household 2’s net income actually decreases with time, whereas Household 1’s increase monotonically.) As is evident from the plot, the magnitude of the difference is dramatic – rising from $3,000 less in 2014 to $18,300 less in 2023.
In terms of net present value, at the end of ten years, Household 1 has accumulated $67,600 more wealth than Household 2, despite earning slightly less income. Were Household 2 to forgo that additional $1 each year, thereby making itself eligible for subsidies, the total cost to the federal government (which includes lost tax revenues and subsidy payouts) over the ten years would be $76,900.
In the second case, Household 2 has an AGI of $65,581, i.e., $3,541 more than Household 1, see plot below.
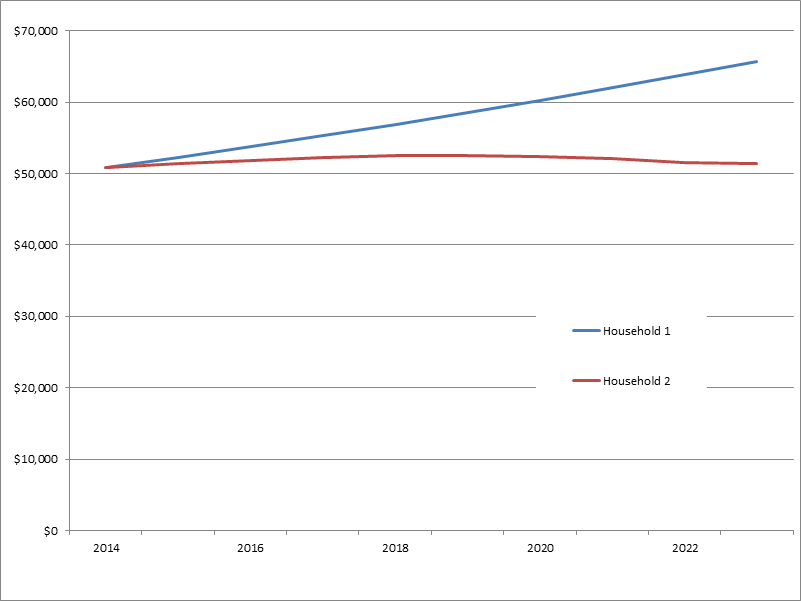
This value was chosen such that the net income in 2014 for both households is the same. However, as with the case above, due to the faster increase in the cost of health insurance, Household 2 again has less net income than Household 1. (And, again, over the ten year period, Household 2’s net income does not increase.) In terms of net present value, at the end of ten years, Household 1 has accumulated $40,000 more wealth than Household 2, despite earning less income. Were Household 2 to accept lower levels of income in order to make itself eligible for subsidies, the total cost to the federal government (which includes lost tax revenues and subsidy payouts) over the ten years would be $82,300.
In the third case, Household 2 has an AGI of $70,706 in 2014, i.e., $8,670 more than Household 1, see plot below.
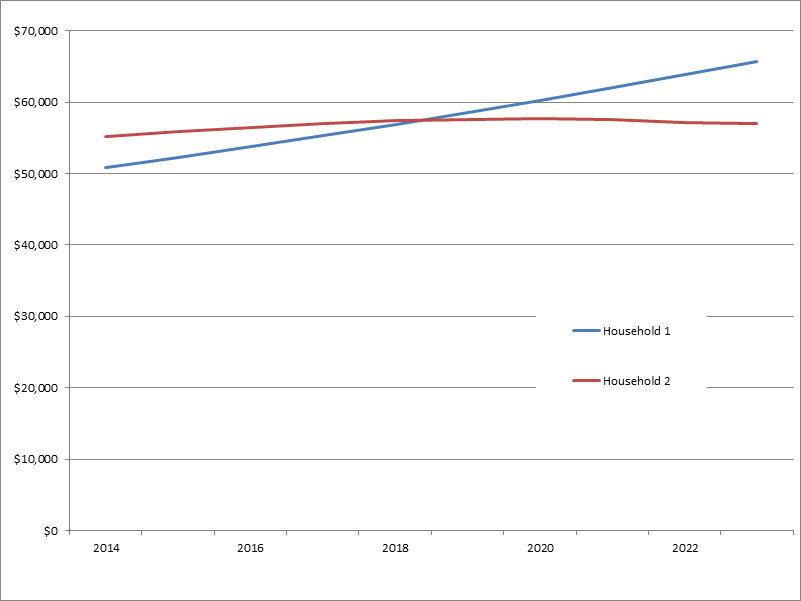
This value was chosen such that the present value of both households’ wealth is the same at the end of ten years (but note, that starting in year 11, Household 1 will have more wealth than Household 2). To achieve this ‘parity’, Household 2 has to work an additional 195 hours per year (assuming time-and-a-half overtime pay), more than an additional full month of labor per year, just to maintain parity. Were Household 2 to accept lower levels of income in order to make itself eligible for subsidies, the total cost to the federal government (which includes lost tax revenues and subsidy payouts) over the ten years would be $90,100.
Conclusions
What these cases clearly demonstrate is that for those households whose AGI is close to 400% of the FPL (it is estimated that there are approximately three million such households), it is in their best interest to accept lower gross income in order to have greater net income. Such a strong disincentive is contrary to the American credo – that those who make more should end up with more. This author is unaware of any other US laws which have violated this credo.
The ACA will also accelerate the widening of the wealth gap as many people are likely to forgo salary raises because such raises would result in their having less net income. This will tend to further separate society into two groups – those who make less than 400% of FPL and those who make significantly more, with very few people remaining in the middle. In short, the ACA wil destroy the middle class.
In addition, as people become better aware of this issue and act in their own best interest, i.e., maximize their net income, the cost to the federal government will skyrocket. For the ten year period examined in this article, said cost could easily exceed $200 billion for just the 3 million effected households.
In summary: Something desperately needed to be done to address the lack of access to affordable medical care in the United States, however, the ACA is so poorly conceived that it will probably have minimal impact on the problem it was intended to address while greatly exacerbating other societal problems.
Assumptions regarding parameter values
- Insurance premium: The plan chosen was the second least expensive sliver plan for a household of two living in Washtenaw County, Michigan. The current price of this plan was obtained for people ranging in age from 50 years old, $792 per month, to 59 year olds, $1,082 per month.
- Household income growth: It is assumed that the growth rate for the next ten years will be the same as for the last 13 years. Household income increased by 47% from 1999 to 2012, which is equivalent to an annual compound growth rate of 3.0%. It is further assumed that the poverty level will increase at the same rate as the growth of household income.
- Inflation: It is assumed that the growth rate for the next ten years will be the same as for the last 13 years. Inflation increased by 38% from 1999 to 2012, which is equivalent to an annual compound growth rate of 2.5%.
- Health insurance premium growth: It is assumed that the growth rate for the next ten years will be the same as for the last 13 years. Health insurance premiums increased by 172% from 1999 to 2012, which is equivalent to an annual compound growth rate of 8.0%. While it is true that the growth rate slowed from 2011-2014, recent reports indicate that near future increases could exceed 10%, thus the assumed value seems to be fair. It is assumed that the inflation rate applies equally for all age brackets.
- Income taxes: It is assumed that the basic structure for calculating personal income taxes will not change over the next decade. It is also assumed that the values of personal exemption, the standard deduction, and the income tax brackets will all increase. To estimate the future values for these parameters, the rate increase from 2013 to 2014 was calculated, and this rate was used for all future years.
Closing comments
Some might object to the rate of medical insurance inflation used in this model. However, the core findings, that those who make more wind up with less, will remain true for so long as the rate at which medical insurance costs increase is greater than the rate at which household incomes increase.
For those so inclined, the spreadsheet which was used to develop the models is available here.